Patient Monitoring Systems: A Cornerstone of Modern Healthcare

Remote Patient Monitoring (RPM) is a healthcare delivery model that utilizes technology to monitor patients’ health conditions from a distance. This approach enables healthcare providers to track vital signs, symptoms, and medication adherence, often in real-time. RPM systems typically involve wearable devices, sensors, and mobile applications that collect data and transmit it to healthcare professionals for analysis and intervention.

Understanding LLMs

LLMs means understanding how these smart computer programs use vast amounts of text to learn language rules and meanings. They can then answer questions, write essays, translate languages and even chat like humans. LLMs are handy in customer service, education, and healthcare for tasks like understanding and creating language. They are not flawless and can make errors, especially with tricky information.

Data Cleaning – Turning Data into Value

Data cleaning is the process of finding and fixing mistakes or inconsistencies in data to make sure it is correct, consistent and usable. The goal is to improve the quality of the data so it can be used reliably for analysis and decision-making.

It transforms messy data into a valuable asset, enabling businesses to make informed decisions, gain competitive advantages and drive innovation.

Investing in data cleaning helps organizations avoid biased insights, improve productivity and efficiency, meet compliance and reporting needs, leading to overall cost savings.

Collaboration using DevOps

DevOps is like teamwork for software development and IT operations. It is a way of working where developers and operations folks collaborate closely throughout the entire software development lifecycle.

Instead of working separately and throwing things over the fence to each other, they work together from the start to the finish line. This helps in making the software development process faster, more efficient and more reliable.

Effective, Engaging Visualizing Data

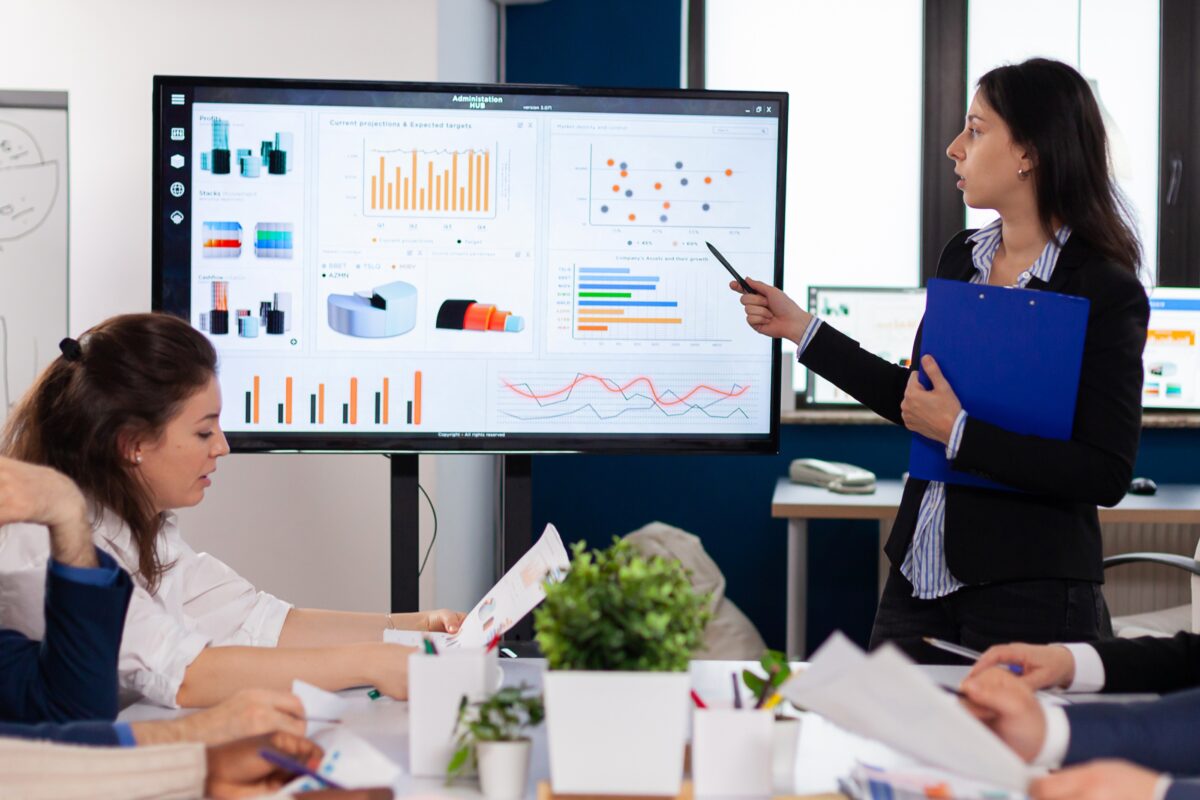
Data visualization means showing information using pictures, like charts, graphs, and animations. These pictures make it easier to understand complicated data and see important patterns and trends.

A picture is worth a thousand words. It is a better communication method. It is used to see data in context. It immediately attracts attention thus helping to tell a story.